Flag patterns are integral to technical analysis and are widely used by traders because of their reliability in predicting probable movements. These figures on price charts are the main tools for both beginners and experienced market participants. Understanding flag patterns, their types, characteristics, and consequences, is important for developing an informed trading strategy.
In the simplest terms, a flag pattern forms when the market consolidates following a sharp movement in price. This usually gives way to the formation of either a rectangle or a parallelogram in the chart. Such consolidation is often considered a minor halt during which prices move in narrow boundaries until the initial trend either continues or reverses. Flag patterns generally come as bullish and bearish, each one showing certain market sentiment and possibilities for further trade.
Bullish flag pattern
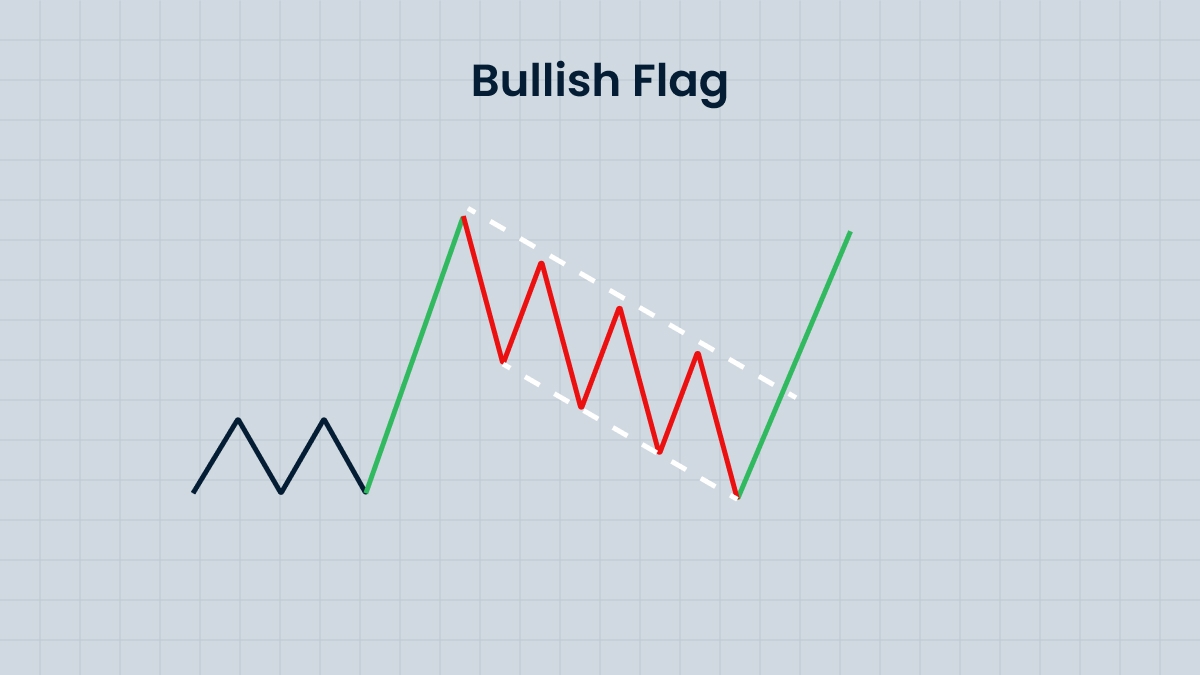
The bullish flag pattern usually appears after a strong upward price movement. It begins with a steep rise called a "pole", followed by a consolidation phase when prices decline slightly or move horizontally, forming a "flag". This temporary pullback often reflects traders taking profits after the initial surge. However, the underlying bullish sentiment is still strong, so once this consolidation ends, prices are liable to surge upwards, continuing the previous trend. Traders often look for a breakout above the upper limit of the flag as confirmation to open long positions.
For example, the stock may have jumped up significantly as a result of good earnings reports. After moving up, the stock may enter into a very narrow range — a flag pattern. A break above the range, usually on high trading volumes, will signal renewed buying interest and further upward momentum. Traders often use very specific entry points and stop-loss levels beneath the lower limit of the flag to manage risks.
Bearish flag pattern
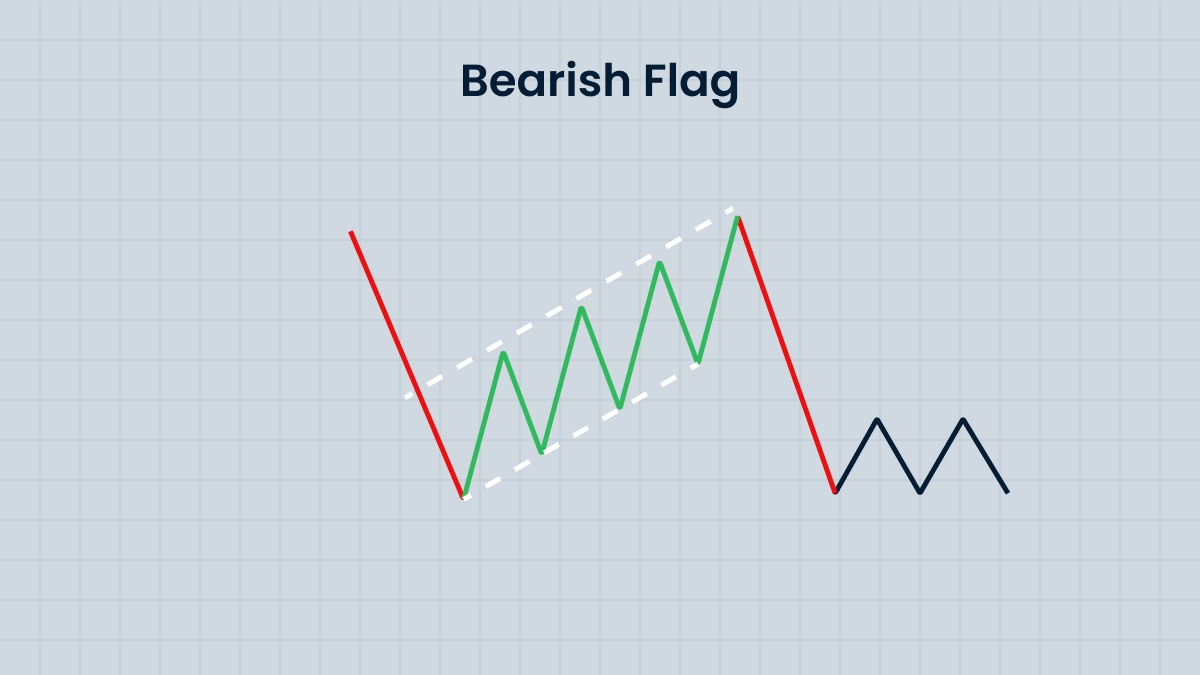
Conversely, the bearish flag pattern appears in a downtrend. It starts with a sharp drop in prices, forming a pole; followed by a consolidation with the prices moving upward or horizontally, forming a flag. What this pattern means is a temporary termination of the downtrend, which is often explained by the closing of short positions or speculative purchases. Once the consolidation is complete, prices often break through the lower boundary of the flag and continue the downtrend.
As an example of this, during a bear market influenced by negative macroeconomic data, a steep fall in prices can be followed by a gradual recovery or a sideways movement at the same level — a bear flag. A further break below the lower boundary of the flag normally confirms continuation of the downtrend, thus opening short positions. Accurate volume analysis may further raise the possibility of a breakout since such movements are usually accompanied by increased selling pressure.
Already know how to trade? Time to put your skills into action!
Inverted and falling flag patterns
The inverted flag patterns are variations of the normal flag formation. They are, in essence, the opposite: a bear flag forms within an uptrend, while a bullish flag forms within a downtrend. The recognition of these patterns involves proper observation of price behavior and an understanding of market context.
This means that after the upward move, the price settles in and the consolidation period occurs with a "falling flag" pattern — the shape of a bullish flag. It’s called that because its shape resembles that of a falling flag, although it is actually inherently bullish, with the downward bias resulting simply from profit-taking action rather than from any alteration in trend sentiment. Resistance above the upper limit of the flag, if pierced, signals the resumption of the former uptrend. Professional traders often combine flag analysis with Fibonacci retracement levels to confirm support zones for the purpose of benefiting from such patterns.
Continuation vs. reversal flag patterns
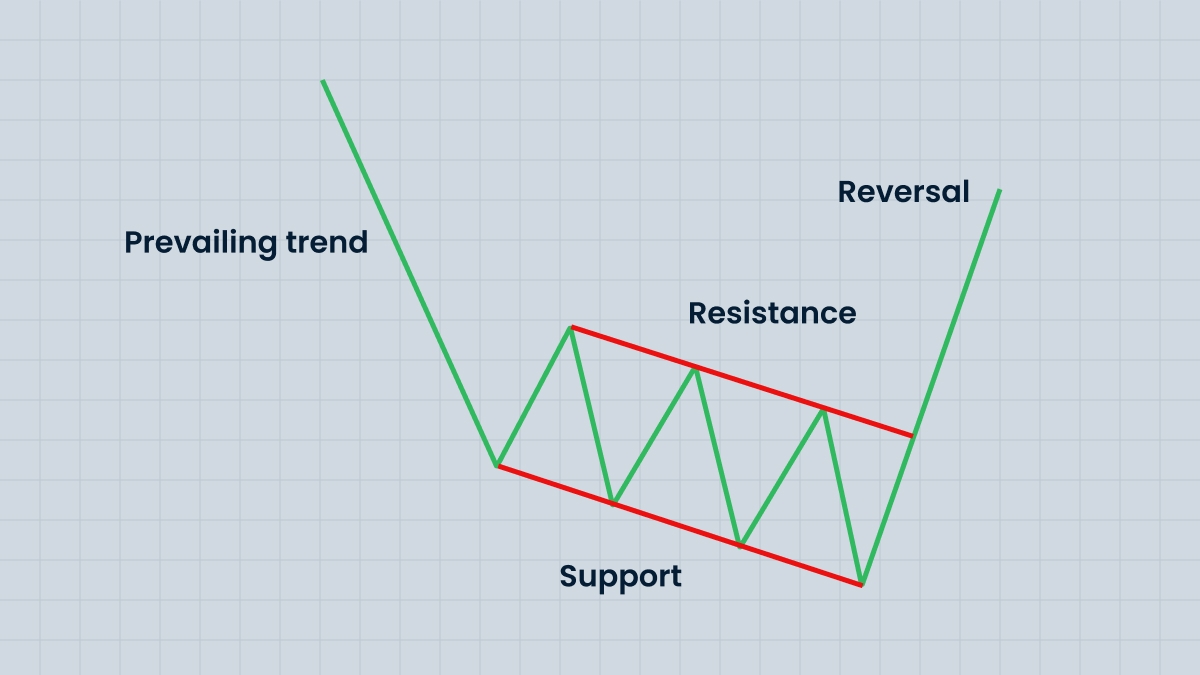
While flag-shaped patterns are mostly continuation patterns that signal the continuation of an existing trend, some variations can act as reversal patterns. A flag-shaped reversal pattern occurs when the direction of a breakout contradicts the prevailing trend. They are less common, but they can provide lucrative opportunities for traders who are able to recognize subtle changes in market dynamics.
For example, in the case of a reversal flag pattern during a bullish phase, a break of the flag below its lower boundary could signal the start of a bearish trend. In contrast, during the bearish phase, if a breakout happens above the upper limit, it may signify a bullish reversal. Such models have to be analyzed carefully along with related factors like trading volume and general market indicators in order to confirm the reversal signal. It is possible to further confirm divergence in potential reversals using oscillators like MACD or RSI, among others.
Flag patterns in advanced trading strategies
Flag patterns are not independent indicators but work best in conjunction with other technical tools. For example, a bullish flag breakout might occur in conjunction with support from the moving averages, such as the 50-day or 200-day moving averages, or some kind of bullish divergence on oscillators like the MACD or RSI, in which case the signal would have more credence. It can also correspond to a bear flag breakout that coincides with resistance levels or overbought conditions on the RSI - or, better yet, a bearish divergence - which adds more confirmation for opening short positions.
Professional traders base price benchmarks on the length of the flagpole, calculated from the breakout point and often consider them for potential price movements. In this respect, this approach could be labeled as "weighted movement" because it provides a workable matrix for setting profit targets and adequate risk management. Another important thing to consider is the trading volume while the breakout occurs; usually, high volume points to the certainty of the model. A sudden spike in volume during a breakout is considered by many to be a strong confirmation signal.
Another sophisticated strategy involves integrating flag patterns in algorithmic trading systems. Traders will incorporate specific criteria, such as parameters of flag formation, volume thresholds, breakdown confirmation signals, and time limits, into a program for automated identification and execution of trades. It helps a trader enhance efficiency, while eradicating emotional bias when making trading decisions. A possible scenario: upon the confirmation of a 20% volume increase in a bullish flag breakout and validation by a MACD crossover, the algorithm can generate a buy order.
Moreover, the combination of flag patterns with other advanced techniques like Elliott Wave Theory, or Gann Analysis, allows one to gain even better insight into market structure and potential price targets. For instance, the formation of a bullish flag in the context of an impulsive Elliott wave would suggest the continuation of a broader trend, while comparing Gann angles with flag breakouts can help identify the exact entry and exit points.
Common pitfalls and considerations
Despite their utility, flag models are not reliable. One common risk involved with them is a false breakout, where prices temporarily go beyond the boundaries of the flag before changing direction.
To reduce this risk, traders should avoid hasty entries and seek confirmation from multiple indicators or broader market trends.
Besides, one needs to be aware of the context in which the flag pattern is built. Economic events, corporate announcements, and geopolitical factors may have a strong impact on market behavior and can render technical patterns invalid. Combining technical analysis with fundamental information increases the reliability of your trading decisions. Experienced traders often follow the news and economic calendars to align their technical strategies with macroeconomic trends.
Flag patterns across different markets
These flag models apply to forex, commodities, and cryptocurrency markets alike. Each of the markets possesses different characteristics that affect the way flag patterns are formed, including breakouts.
In the forex market, flag patterns quite often take shape on great economic news, such as the release of interest rate decisions or employment reports. High liquidity and a 24-hour trading environment in forex currency markets create situations for really fast flag formations and breakouts. Traders need to keep an eye out and be quick to respond so they don't miss that moment.
In commodity trading, several trends are to be observed because of supply and demand shocks, geopolitical tensions, or seasonal tendencies. For example, oil prices may develop a bullish trend after supply disruptions. Such a breakthrough generally signals further price increases. In the same vein, agricultural products could also show particular characteristics during the time of harvest or in relation to weather conditions.
Flagship patterns in cryptocurrency markets, which are naturally volatile, are very common. Due to the speculative nature of the cryptocurrency markets, they may lead to excessive flag formations and sharp breakouts. Still, one must be cautious as false breakouts are common in highly volatile markets. Flag analysis combined with indicators of sentiment and blockchain data could enhance trading accuracy in these kinds of markets.
Want to put your new knowledge into practice?
What about risks?
Despite their usefulness, the flag models are not infallible. False breakouts — when prices temporarily break the boundaries of the flag before changing direction — pose a significant risk. To reduce this risk, traders should avoid hasty entries and seek confirmation from multiple indicators or broader market trends.
One of the efficient methods of risk management is the use of multi-timeframe analysis. By studying flag patterns on different timeframes, traders can assess the strength and reliability of a pattern. For example, the flag pattern seen on the 15-minute chart may generate additional confidence if similar patterns are found on the hourly or daily charts.
Moreover, the context of the flag pattern is essential to interpreting it correctly. Economic news, corporate statements, and geopolitical influences may broadly affect market fluctuations and even neutralize technical signals. That means that technical analysis together with fundamental data boosts the reliability of your trading decision. Advanced traders usually watch the news, economic calendars, and market sentiment indicators to align their technical strategies in correspondence with the macroeconomic situation.
Summary
Whether bullish, bearish, inverted, or descending, the flag pattern provides the trader with the most important market dynamics data on continuation and reversal opportunities. This ability to recognize and explain any of these patterns sharpens the trader’s acumen for a continually refined approach towards strategy building and decision making. Their successful use, however, requires a comprehensive view that links technical analysis and risk management, as well as detailed knowledge of market conditions. Flag patterns are more than a guiding rule for professional traders; they form the bedrock of technical analysis, leading the way to making regular and well-informed trading decisions.
