Technical analysis is key to modern trading, providing traders with an important tool in making well-informed decisions based on the behavior of markets. It is fundamentally a study of past market data, most often price and volume, with the goal of predicting future movements in prices. It’s based on the principle that historical patterns in price, and market trends as a whole, could indicate future potential activity. This makes it a critical skill for traders of all asset classes.
Fundamentals of technical analysis
Technical analysis is based on three basic premises.
It assumes that everything related to an asset — from macroeconomic events to company news — is reflected in its price. This concept, known as the efficient market hypothesis, identifies price as the leading indicator of market perception.
Technical analysts believe that prices have a tendency to move in trends — up, down, or sideways — and, until clear signals to the contrary occur, these trends are more likely to continue than reverse.
Human behavior is repetitive, forming patterns that will repeat themselves many times due to collective psychology. These patterns can be identified using charts and indicators.
Technical analysis is underpinned by the concept of supply and demand, where price changes reflect the shifting balance between buyers and sellers. When demand exceeds supply, prices rise, and when supply exceeds demand, prices fall. Understanding these dynamics is essential to understanding market behavior and making informed trading decisions. By studying price movements and trading volumes, technical analysts seek to identify these imbalances and anticipate future market movements.
Key components
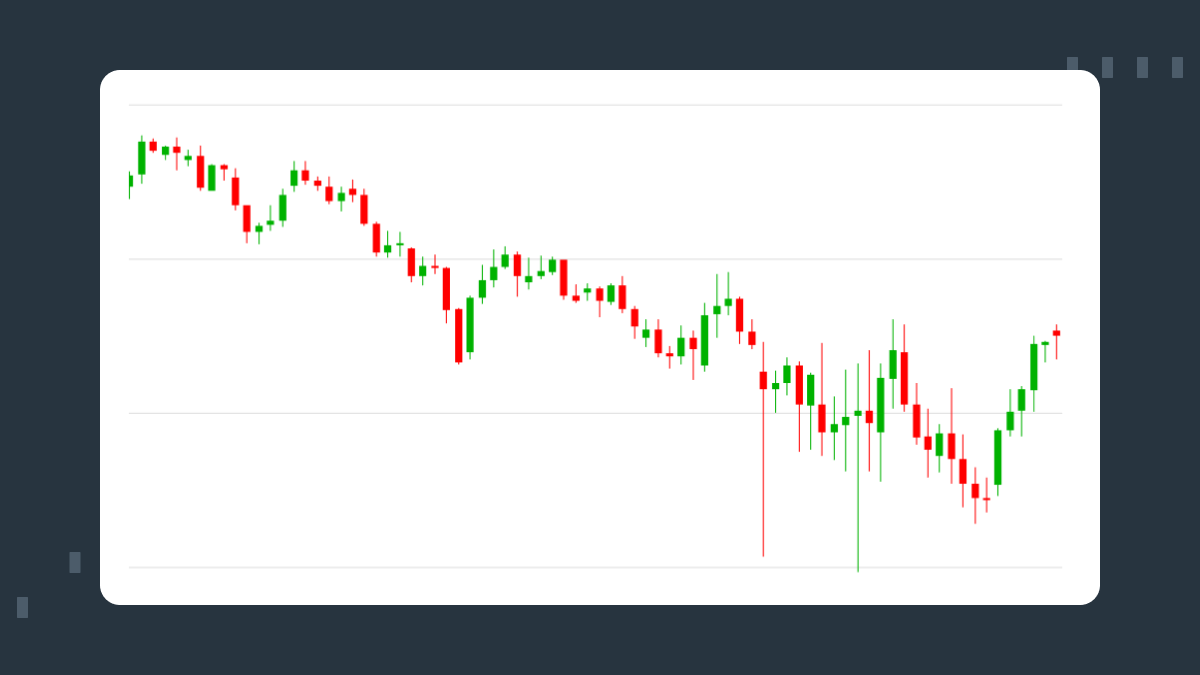
The chart is a building block of any technical trading analysis. A chart visually displays the fluctuation of price against time, which enables this tool to be used for pattern and trend identification. Among major chart types, traders use the line chart, bar chart, and candlestick chart to get variable looks at market behavior. Among them, candlestick charts are most in demand because they provide the most detailed information about the opening, closing, high, and low prices of an asset for any period. Indicators and oscillators form the technical basis of trading analysis.
For example, moving averages smooth out the noise in the price series to accentuate the prevailing trend, while indicators such as the relative strength index and moving average convergence divergence yield insight into momentum and possible reversals. Bollinger bands, Fibonacci retracements, and Ichimoku clouds are also key tools investigated for deeper insight into price dynamics. All of these together give a broader view to the market dynamics that enable traders to make better and more confident decisions in adverse conditions.
Another key element is volume analysis. Volume is the total number of shares or contracts traded during a certain period and is normally viewed as a leading indicator of price changes. For example, a spike in volume can be the start of a new trend or an acceleration in one already underway. Conversely, falling volume within an uptrend may be an early warning that momentum is weakening and the trend is about to change. By combining volume with price patterns, traders can first confirm the breakouts occurring, and estimate the strength of the market's movements.
Support and resistance are levels of psychological barriers in the market.
Support is the level of price at which buying interest is strong enough to prevent a further decline, while resistance is a level at which selling pressure is strong enough to stop an upward trend.
Often, these levels are decision zones that give insight into traders’ sentiments and thus provide a leeway to formulate entry and exit strategies. Moving averages and other forms of dynamic support and resistance levels also enhance the trader's ability to adapt to changing market conditions.
The role of patterns
Patterns form the heartbeat of technical analysis and are representative of struggle and tug-of-war between buyers and sellers. In patterns, two major categories come to the fore: continuation and reversal. Continuation patterns involve flags, triangles, or pennants, and this indicates that a trend should be continuing in the direction it was moving; a reversal pattern may identify a change in the trend direction, and will include head and shoulders and double tops.
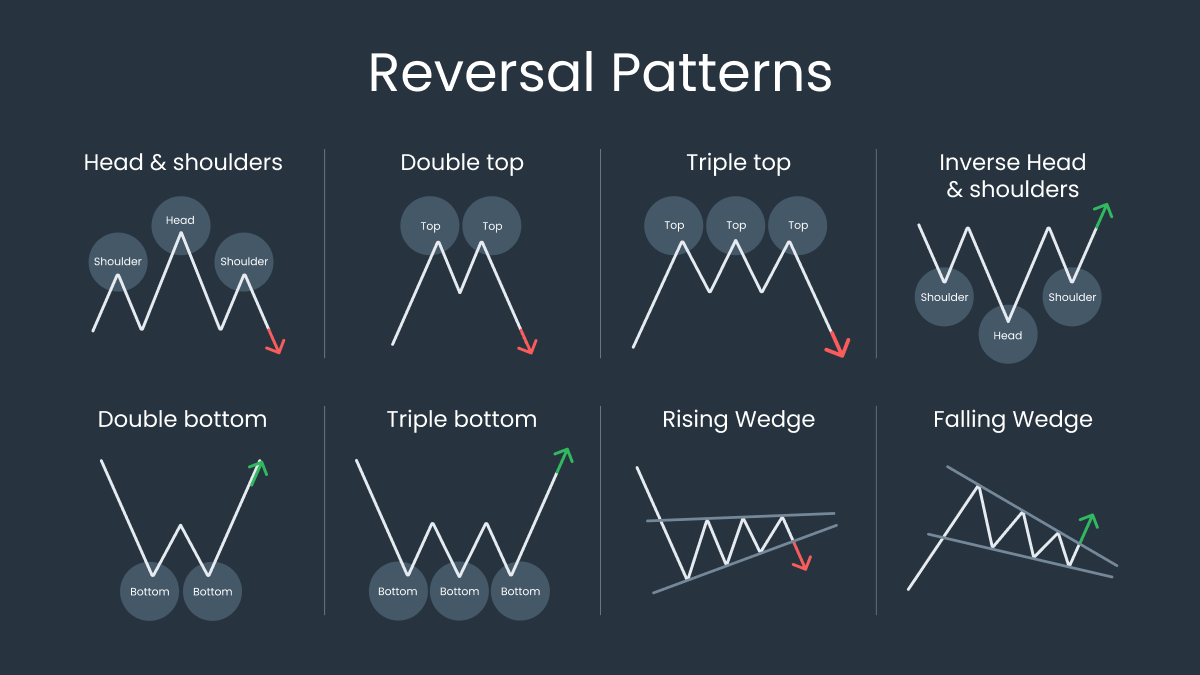
These patterns are more than just shapes; they show the emotions and psychological features of traders’ behavior. While a head and shoulders pattern often shows up when the bullish momentum is weak and there is a bearish reversal, a bull flag shows strong interest in buying after a short halt. While it takes practice and a good understanding of market dynamics to effectively spot and use these patterns, they can help traders time their trades accurately.
More complex patterns, such as harmonics — Gartley, Bat, or Butterfly — offer an additional layer of complexity. They rely on Fibonacci ratios to define levels of support and resistance with uncanny accuracy. The setups can prove to be effective with experienced traders who want an edge.
Already know the basics of trading? What are you waiting for?
How technical indicators work
Technical analysis indicators are tools traders use to identify trends, momentum, and probable trend reversals.
The most common starting point is a moving average, smoothing out price data over time. The simple moving averages (SMA) and exponential moving averages (EMA) present the trend more clearly.
Momentum indicators reflect the velocity of price fluctuation. For instance, suppose the RSI ranges between 0 and 100, with RSI readings exceeding 70 specifying that the market is overbought. Though the market is still said to be oversold, you can tell that it is in fact due for a decline. If a reading below 30 is observed, a rally becomes virtually impossible.
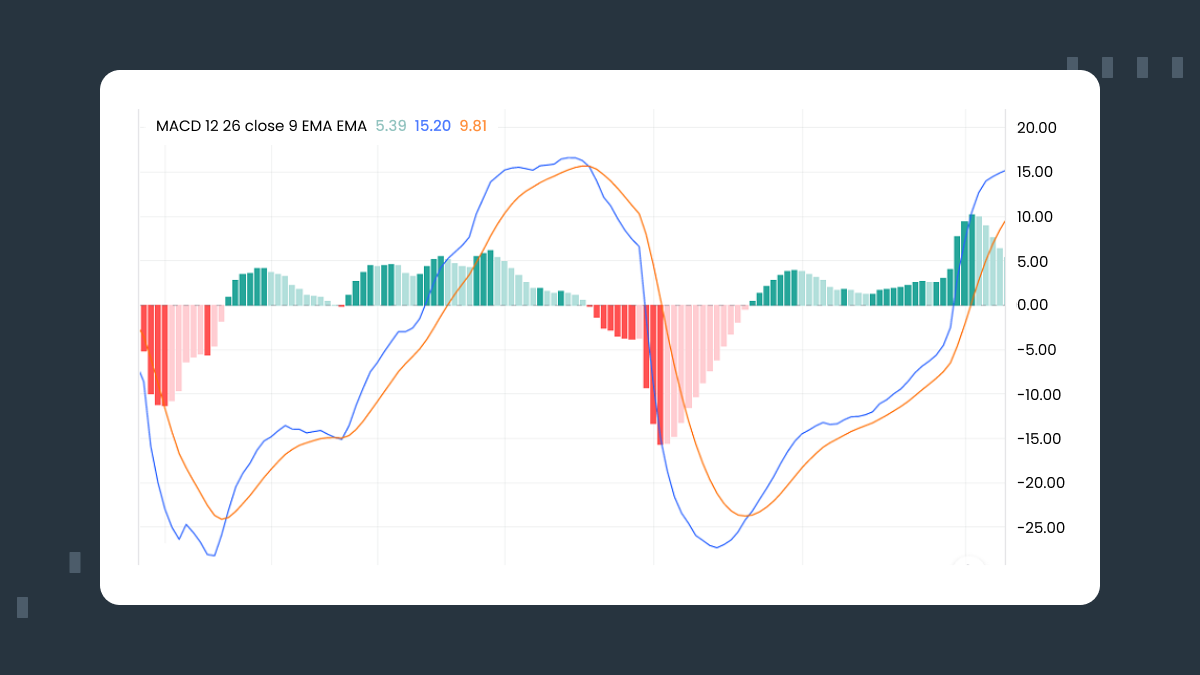
MACD represents moving average convergence divergence: basically a mix of trend following and momentum analysis. It plots a signal line by comparing two moving averages, giving clues on reversals. Traders usually use crossovers between the MACD line and the signal line as action triggers.
Through the study of price movement based on trading volume, volume indicators like on-balance volume and Chaikin money flow show the strength of a trend. For instance, the OBV shows whether volume is supporting or deviating from a trend, thus providing the main insight for decision making.
Implementing technical analysis
Technical analysis is not a one-size-fits-all approach; it's more a set of flexible tools to be adapted toward your trading style. Day traders focus on short-term movement using momentum indicators, while swing traders analyze medium-term trends with daily or weekly charts. Position traders look at longer timeframes to capture market cycles.
Technology has made technical analysis very accessible. Advanced charting software, trading systems, and custom indicators are all a click away. Mobile apps provide real-time updates, and AI aids in finding the unseen patterns to help make an accurate decision.
Another key milestone of a trading strategy is backtesting. Backtesting strategies allows traders to finetune their approach before investing real money. Although no strategy guarantees future success, backtesting helps identify strengths and weaknesses, thus giving traders a better chance of commanding the market effectively.
Market psychology
Understanding market psychology is an integral part of effective technical analysis. Prices are ultimately driven by the mass emotions of market participants who feel fear, greed, and optimism. Technical tools and models provide a framework for interpreting these emotions, thus enabling traders to anticipate how the market will behave.
For instance, a rise above a resistance level frequently provokes fervent buying impelled by optimism and a fear of missing out. Equally, a slip below a support line triggers panic selling whenever fear sets in. Understanding how these psychological motivations work to build into price actions is the essential ingredient for forging a more evolved trading strategy.
Other market sentiment indicators, such as the put/call ratio and the volatility index (VIX), extend a trader’s ability to gauge collective psychology. For instance, a high put/call ratio is indicative of bearish sentiment, while a low ratio reflects bullish sentiment. These tools complement traditional technical analysis and provide a comprehensive look at market dynamics.
Evolution of technical analysis
The field of technical analysis continuously evolves with the financial markets. Inclusions of algorithmic trading and machine learning have added a whole new dimension to the conventional methodologies. Machine learning models can look for minute patterns and correlations in very large quantities of historical data, which may evade the human eye. Furthermore, an algorithmic trading system can execute trades with super speed and accuracy on predefined technical criteria, hence keeping the trading decisions away from emotional intervention by humans.
Technical analysis has also been affected by the appearance of cryptocurrency markets. It is a highly volatile new market that obliges traders to adopt traditional tools as well as work out new methodologies. The indicators widely used in regular trading, like the RSI and Bollinger bands, are similarly applied to cryptocurrency trading, while innovative methods, including on-chain analysis, introduce further insights possible only with blockchain-based assets.
Sentiment analysis also has a place alongside technical analysis. Traders can get an idea of the general sentiment of market participants by analyzing social media trends, news sentiment, and blockchain data. Thereby they can further help themselves improve their technical strategies. Such a fusion of disciplines ushers in a new era in trading analysis, where tradition meets cutting-edge technology.
Apply your skills and start achieving outstanding results!
Limitations and considerations
Offsetting its many benefits, technical analysis has several limitations. There are so many variables driving the markets that no method can accurately predict price action. False signals and sharp moves — a recipe for losses — underline how vital risk management is. Technical analysis therefore needs to be combined with sound money management — a combination of setting Stop Loss orders and calculating position sizing — to round off a long-term success regimen.
Moreover, technical analysis is extremely subjective. Interpretation and strategy differ and two traders watching the same chart can arrive at different conclusions. Such subjectivity means you must have a disciplined attitude and abide by clearly defined rules in an ongoing process of practice and study. It will be very effective for traders to examine the performance of their strategies, including the practice of backtesting tools. Using historical data, one can test how a certain approach would have fared and then finetune the method. Of course the past may not be an indication of future results, as the market continuously changes.
Also, technical analysis demands that one consistently learns and adapts. Markets are never really static, new tools and methods spring up all the time. It is of essence to keep up to date on these changes if one intends to remain competitive in trading. Some of the ways traders deepen their understanding and improve their skills include trading books, online courses, and professional mentoring programs.
