The US Dollar (USD) continues its upward trend, with USDCAD reaching around 1.4330 as US Treasury yields rise. The US Dollar Index (DXY) is nearing 106.50, boosted by higher Treasury yields of 4.13% for 2-year bonds and 4.33% for 10-year bonds. Federal Reserve official Thomas Barkin predicted a drop in inflation but emphasized a cautious approach due to ongoing uncertainties. The Canadian Dollar (CAD) is under pressure due to US President Trump's confirmation of tariffs on Canadian and Mexican imports. Falling crude oil prices also weigh on the CAD, as Canada is a major oil exporter to the US. Oil prices are falling due to concerns over the US economy and market uncertainty, further impacting the CAD.
GBPCAD – D1 Timeframe
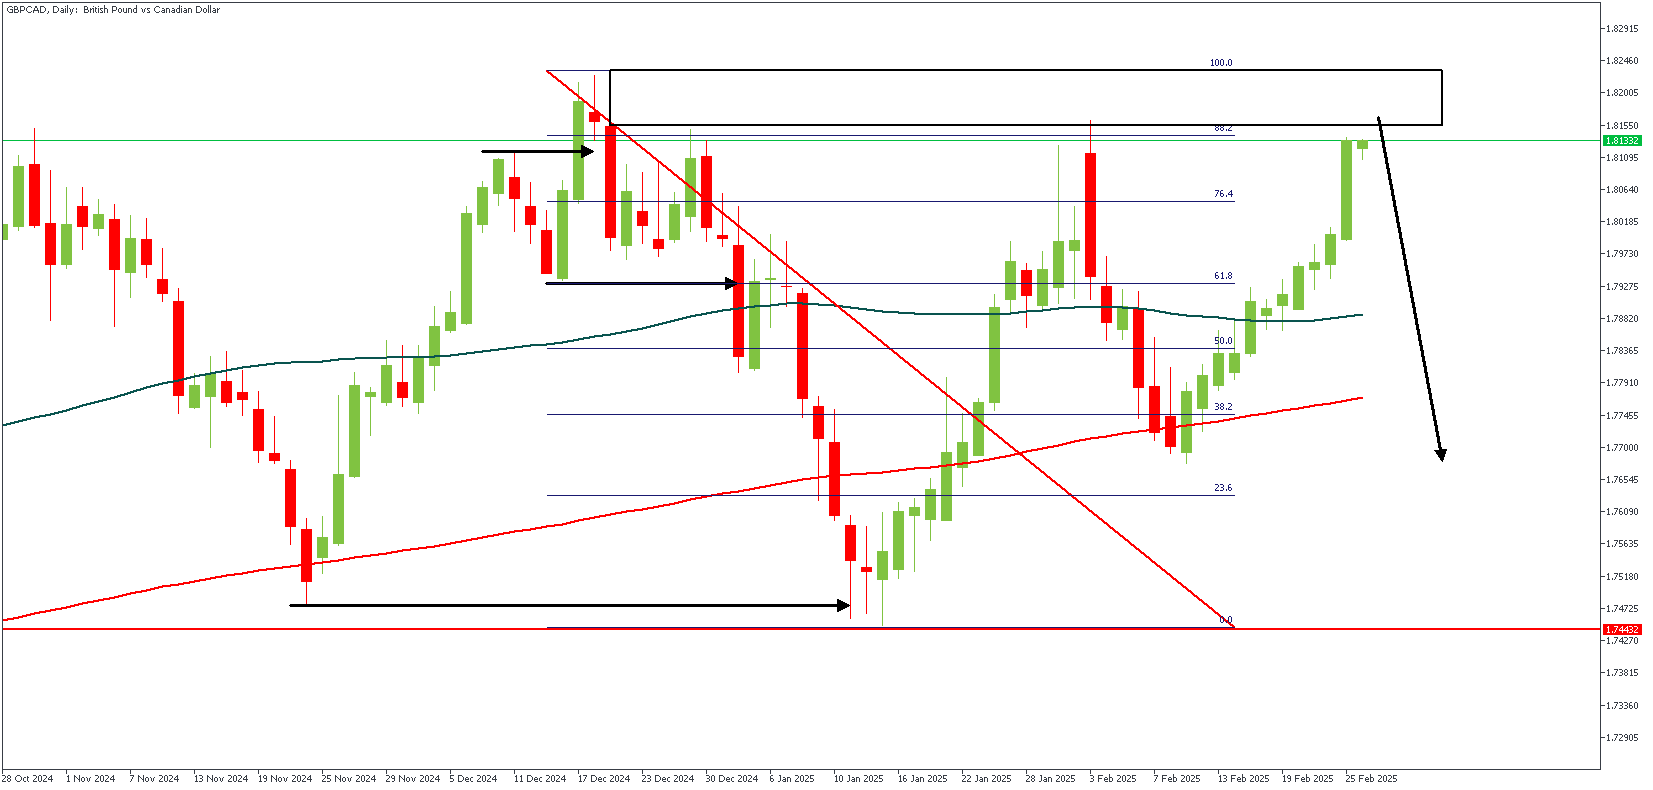
As sketchy as the price action on the daily timeframe chart of GBPCAD looks, a closer look at the trading range reveals that the price swept liquidity from the previous high before breaking structure downwards, creating a classic SBR pattern. In addition, the supply region at the peak of the SBR pattern overlaps the 88% region of the Fibonacci retracement tool, increasing the chance of a bearish reaction from the highlighted supply zone.
GBPCAD – H4 Timeframe
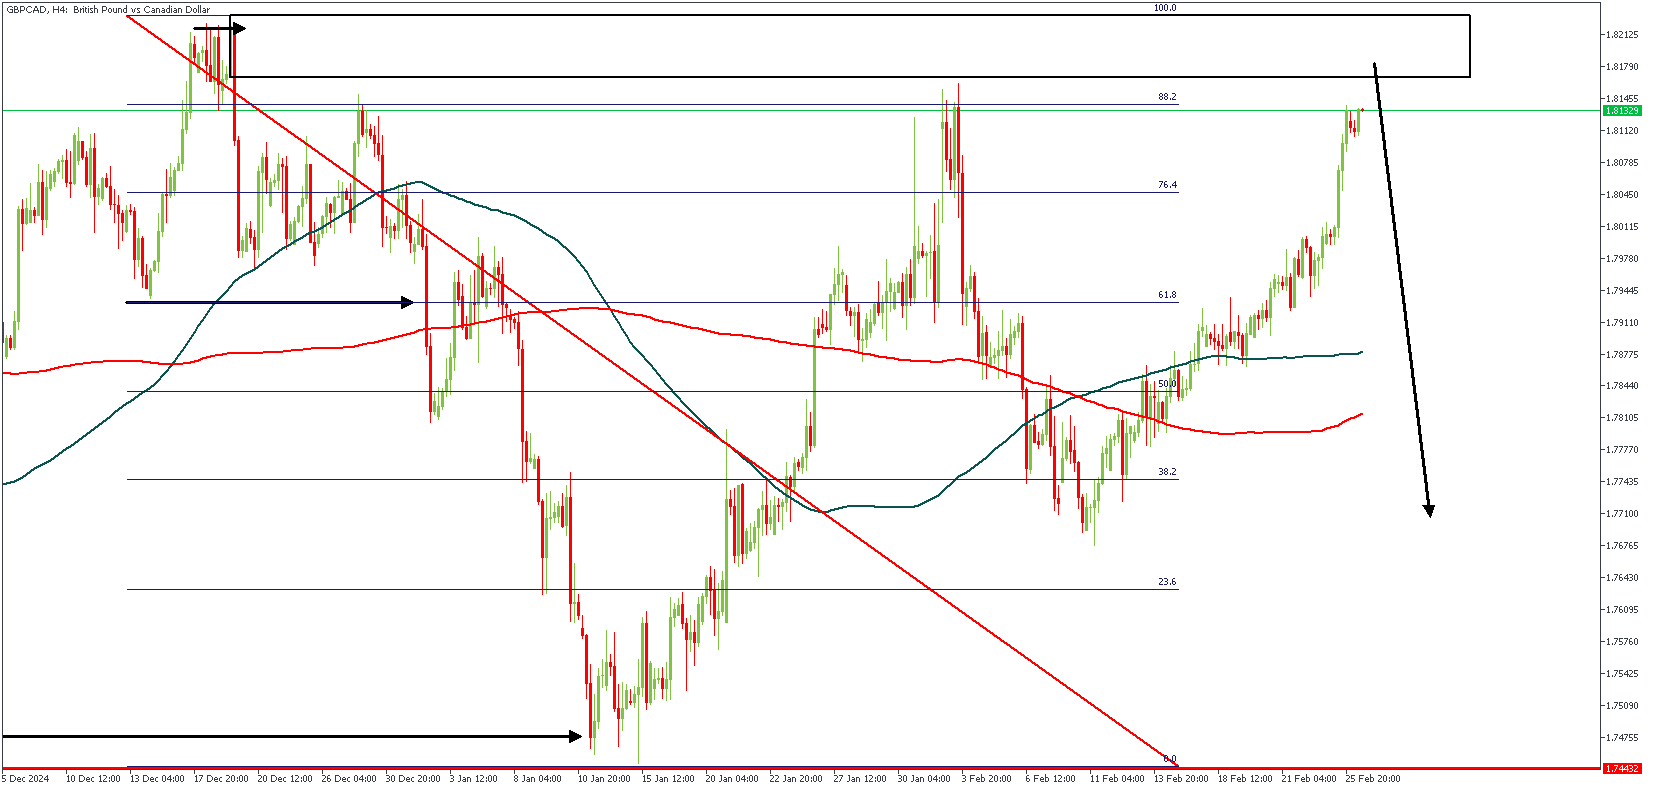
The significant detail from the 4-hour timeframe chart of GBPCAD's price action is the presence of liquidity at the tip of the recent high. The sentiment remains bearish unless the price successfully breaks above the supply zone.
Analyst's Expectations:
Direction: Bearish
Target- 1.76802
Invalidation- 1.82598
CONCLUSION
You can access more trade ideas and prompt market updates on the telegram channel.


